in Quantitative Aptitude recategorized by
0 votes
0 votes

A contour line joins locations having the same height above the mean sea level. The following is a contour plot of a geographical region. Contour lines are shown at $25$ n intervals in this plot.

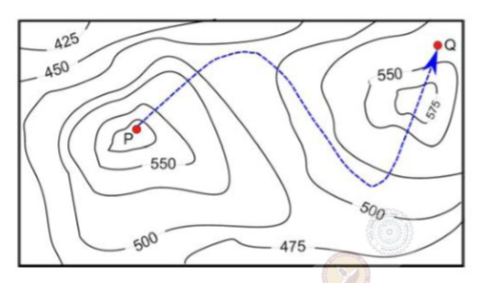
The path from P to Q is best described by

  1. Up-Down-Up-Down
  2. Down-Up-Down-Up
  3. Down-Up-Down
  4. Up-Down-Up
in Quantitative Aptitude recategorized by
7.9k points

Please log in or register to answer this question.

Answer:

Related questions

Welcome to GATE BioTechnology, where you can ask questions and receive answers from other members of the community.