The pie chart presents the percentage contribution of different macronutrients to a typical $2,000$ $\mathrm{kcal}$ diet of a person.
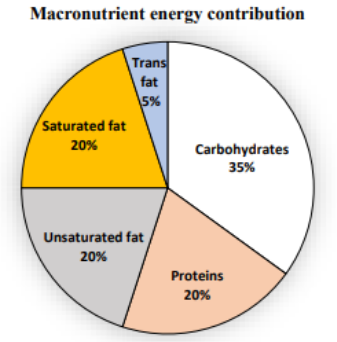
The typical energy density $(\mathrm{kcal} / \mathrm{g})$ of these macronutrients is given in the table.
\begin{array}{|l|c|}
\hline \text{Macronutrient} & \text{Energy density (kcal/g)} \\
\hline \text{Carbohydrates} & 4 \\
\hline \text{Proteins} & 4 \\
\hline \text{Unsaturated fat} & 9 \\
\hline \text{Saturated fat} & 9 \\
\hline \text{Trans fat} & 9 \\
\hline
\end{array}
The total fat (all three types), in grams, this person consumes is
- $44.4$
- $77.8$
- $100$
- $3,600$