in Quantitative Aptitude edited by
0 votes
0 votes


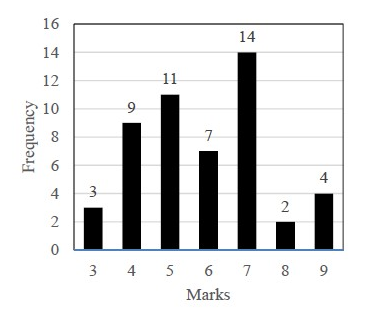
The above frequency chart shows the frequency distribution of marks obtained by a set of students in an exam.

From the data presented above, which one of the following is $\text{CORRECT}$?

  1. mean > mode > median
  2. mode > median> mean
  3. mode > mean > median
  4. median > mode > mean
in Quantitative Aptitude edited by
1.4k points

Please log in or register to answer this question.

Answer:

Related questions

Welcome to GATE BioTechnology, where you can ask questions and receive answers from other members of the community.